
This is Part 2 of a multi-part series on making better maps by thinking about them as graphs and data, based on a talk I gave at Harrisburg University in March 2026.
Last time we built a better vocabulary for discussing maps: paths, edges, districts, nodes, and landmarks. The goal of this second part of the talk was to practice converting game maps into graphs so we can see the data hidden within.
The Exclusion Zone shortcut
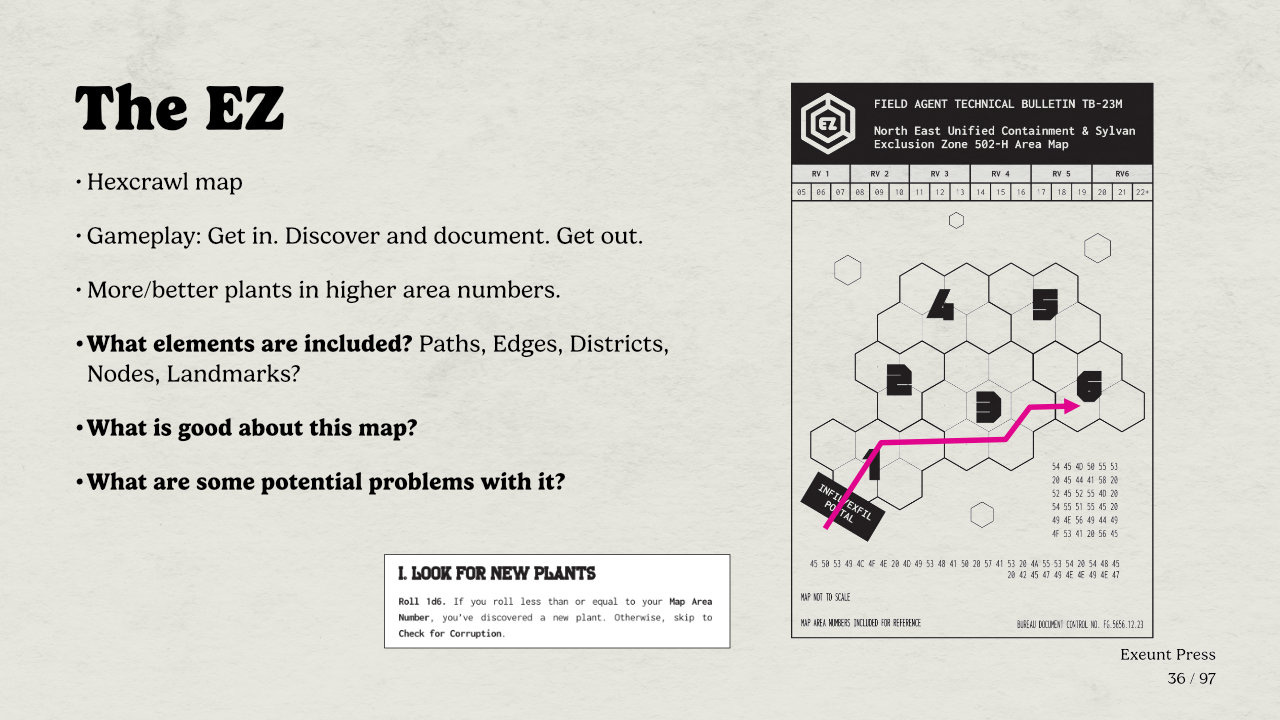
Let’s look at two different maps and see if we can identify the elements we discussed in Part 1 of this series. Take a moment to review that article before we begin!
Exclusion Zone Botanist (by Exeunt Press) is a solo drawing and journaling hexcrawl game set in a dark and mutating forest. You are a botanist assigned to explore Exclusion Zone (EZ), document the strange flora, and get out before you become part of the forest. It’s a push-your-luck game where the “best” plants are in the deepest area (Area 6), but the deeper you go, the more risk there is of being corrupted.
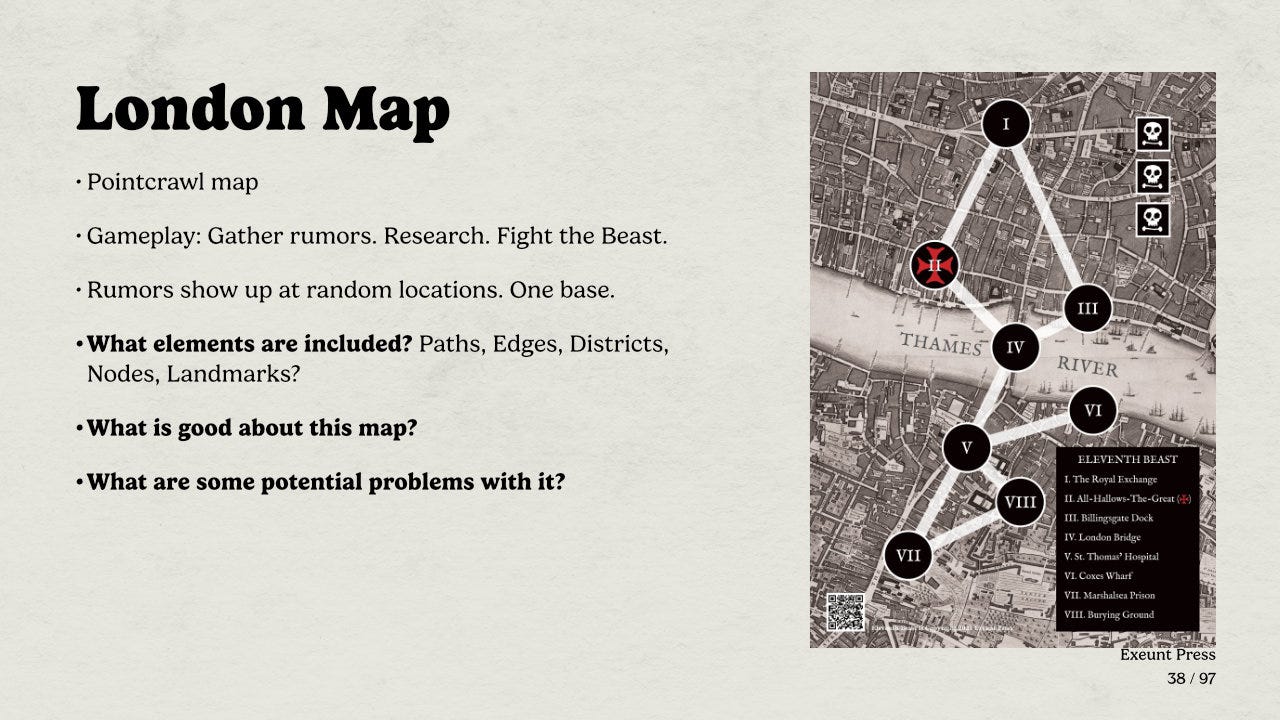
Eleventh Beast (also by Exeunt Press) uses a different kind of map — a pointcrawl map of London with eight named locations and fixed ways to travel between them. Rumors are randomly spawned at the locations and you, as the Hunter, must move around to collect and verify them. Eventually the Beast appears and triggers the conclusion of the game.
Let’s try an exercise using what we learned in Part 1.
📝 Exercise 1: Answer the following questions for both the Exclusion Zone Botanist hexcrawl map and the Eleventh Beast pointcrawl map:
Which elements are included? Paths, edges, districts, nodes, landmarks?
What is good about each map?
What are some potential problems with the maps?
Done?
Let’s proceed!
The maps work well for the games as designed. While working on an expanded map for Exclusion Zone Botanist: Epsilon, however, I noticed that expanding the hexcrawl map led to a potential issue. For reference, the map has concentric Area Rings with the primary objective being to reach the centermost ring and get back out.
Everything is (still) pointcrawl.
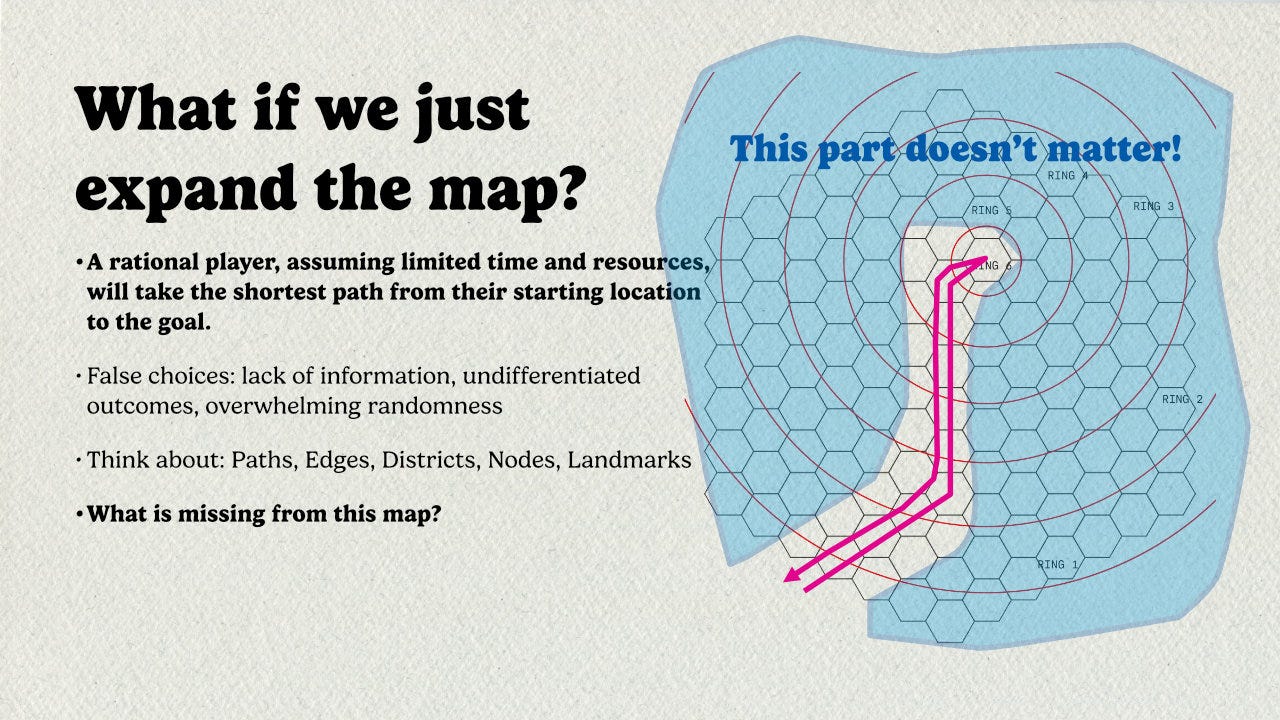
It’s the problem I explained in detail in Everything is Pointcrawl: A rational player, assuming limited time and resources, will take the shortest path from their starting location to the goal.
This means that given an exploration-focused hex map of sufficiently large size but with almost no pre-determined terrain or points of interest, the player will skip most of the hexes.1 They will take the shortest path to the goal and then take the same shortest path on the way back out. The large hexcrawl map then becomes, in effect, a pointcrawl map with just two nodes.
📝 Exercise 2: Let’s try the same exercise as above with the expanded hexcrawl map shown above. Can you identify edges, districts, nodes, and landmarks on this map? Which ones are missing? How does that impact the potential gameplay?
Even with the concentric Area Rings on the map (shown in red) the shortcut through the EZ will still exist. Players may very well ignore a large part of the map.
Translating hexcrawls to pointcrawls
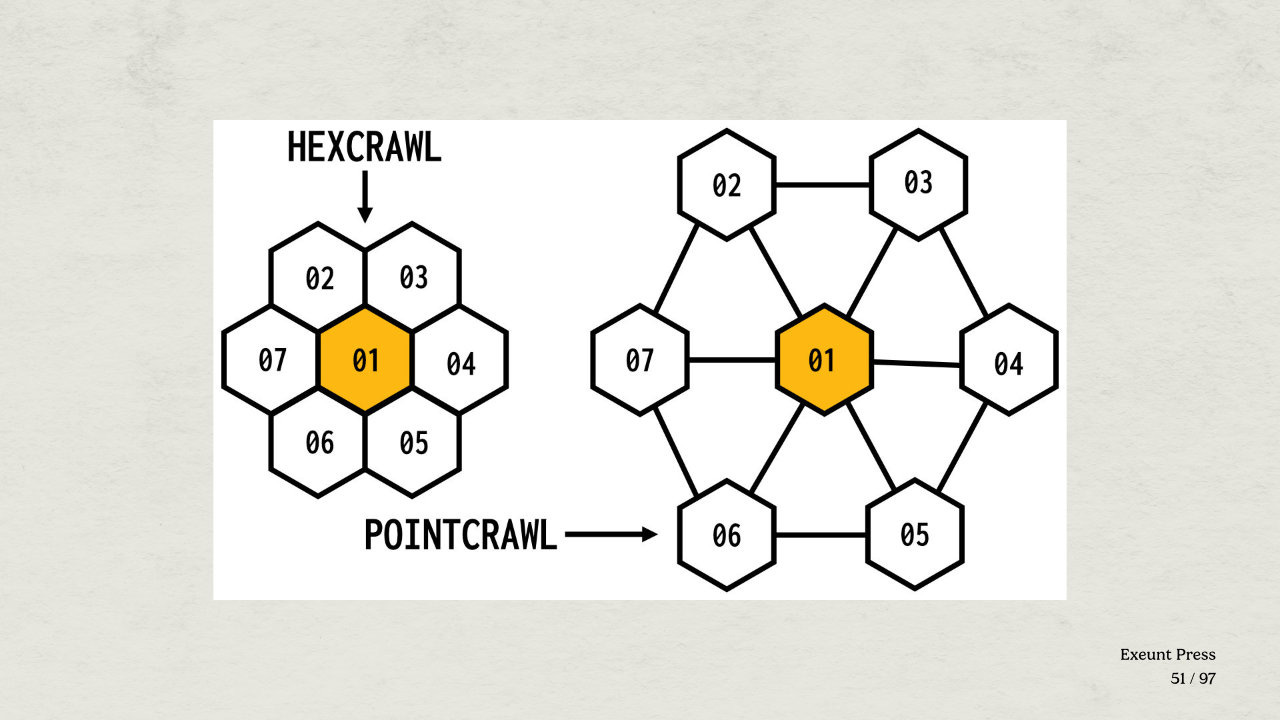
We can actually look at hexcrawl maps as pointcrawl maps. As shown above, a hexcrawl is really just a pointcrawl where every node has 6 connections (paths) to adjacent nodes.
By expressing this map as a pointcrawl, we can both identify and resolve some of the potential issues noted above.2 Consider this revised map:
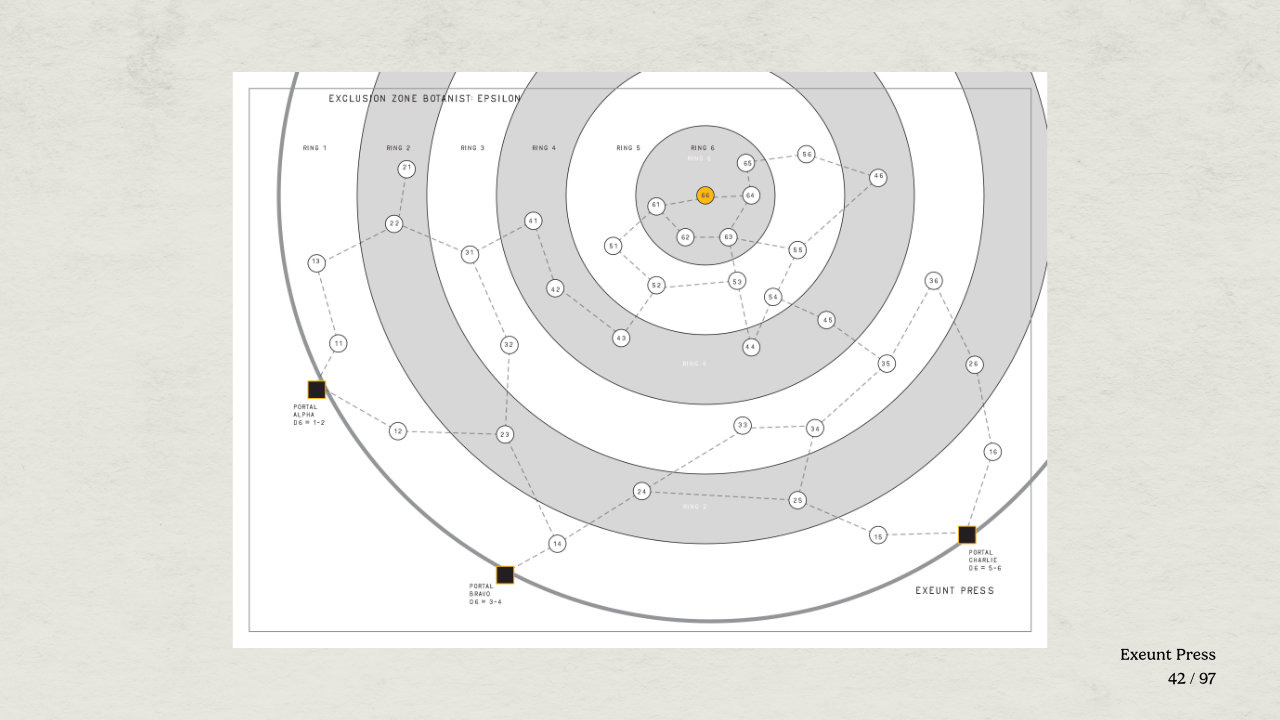
There are fewer nodes with fewer paths connecting them. This immediately constrains movement and makes each route feel different. In addition, we can add multiple entry/exit points, making the starting location matter. And finally, we can overlay the concentric Area Rings to create districts that impact gameplay.
This ability to look at a map and view it as a pointcrawl is a key step in viewing maps as data. We are going to try this with some examples and exercises, but first we need a quick definition!
Wait. It’s all graphs?
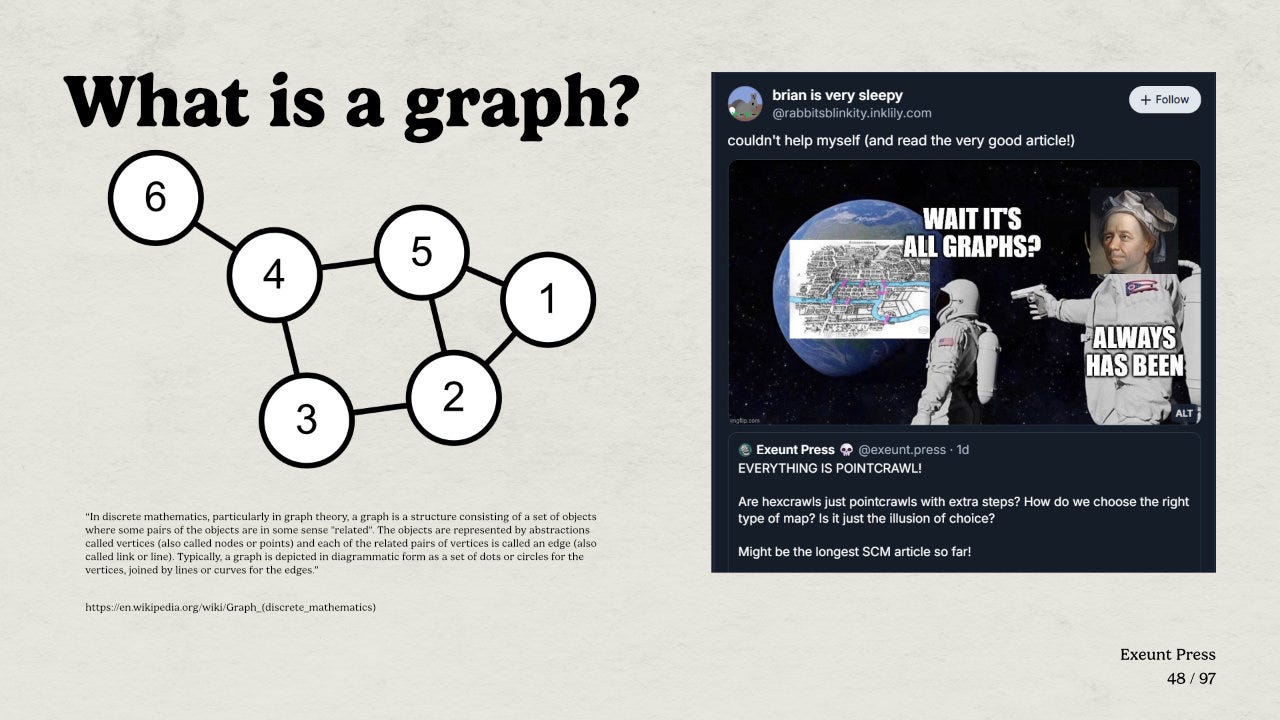
Whereas I’ve been calling maps made of nodes connected by paths “pointcrawl” maps, they could more precisely be called graphs:
“In discrete mathematics, particularly in graph theory, a graph is a structure consisting of a set of objects where some pairs of the objects are in some sense “related”. The objects are represented by abstractions called vertices (also called nodes or points) and each of the related pairs of vertices is called an edge (also called link or line).”3
You can see this illustrated clearly in my early notes from the Ratsail prototype where I sketched out the connections between the various islands.4 I drew the map as a pointcrawl (undirected graph) and then applied an island theme to it.
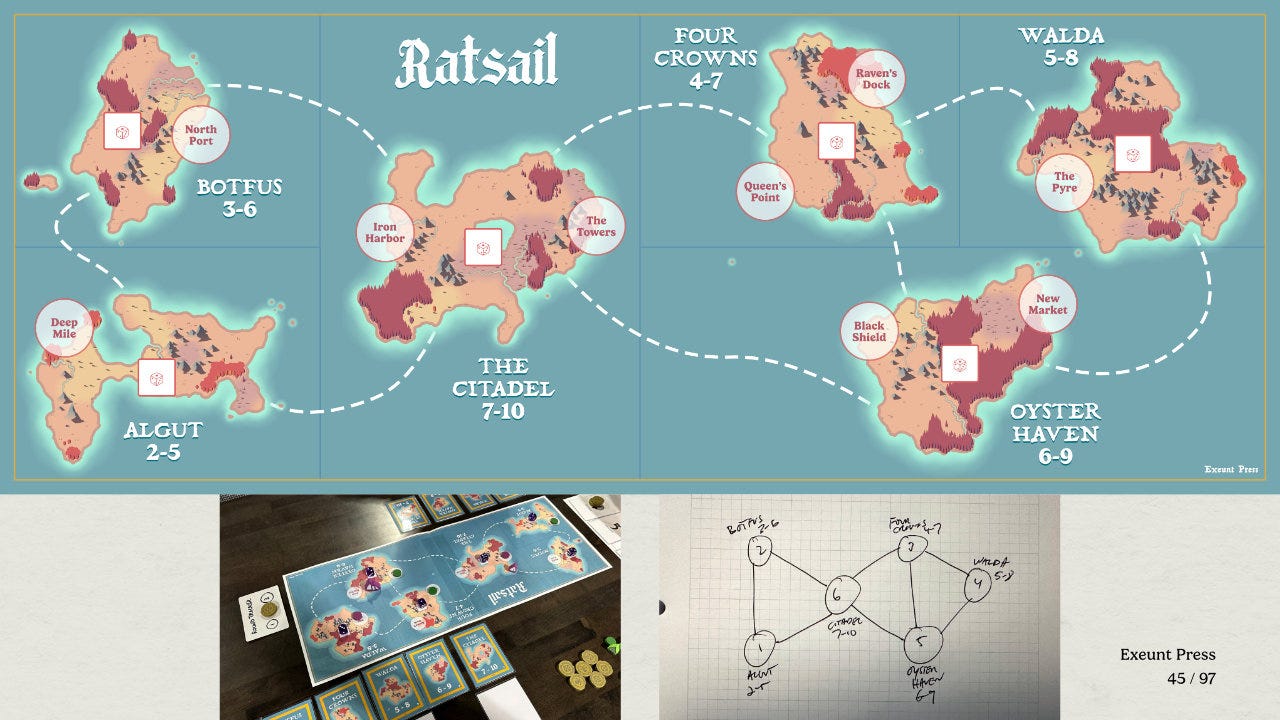
If you were to make a box around each island, it becomes clear that it is still just nodes connected by paths (where paths are to adjacent boxes). There are faint blue lines in the image above showing this.
So if every map is really a graph in disguise, can we convert every map into an equivalent graph? Well, we can certainly try!
Converting maps into graphs
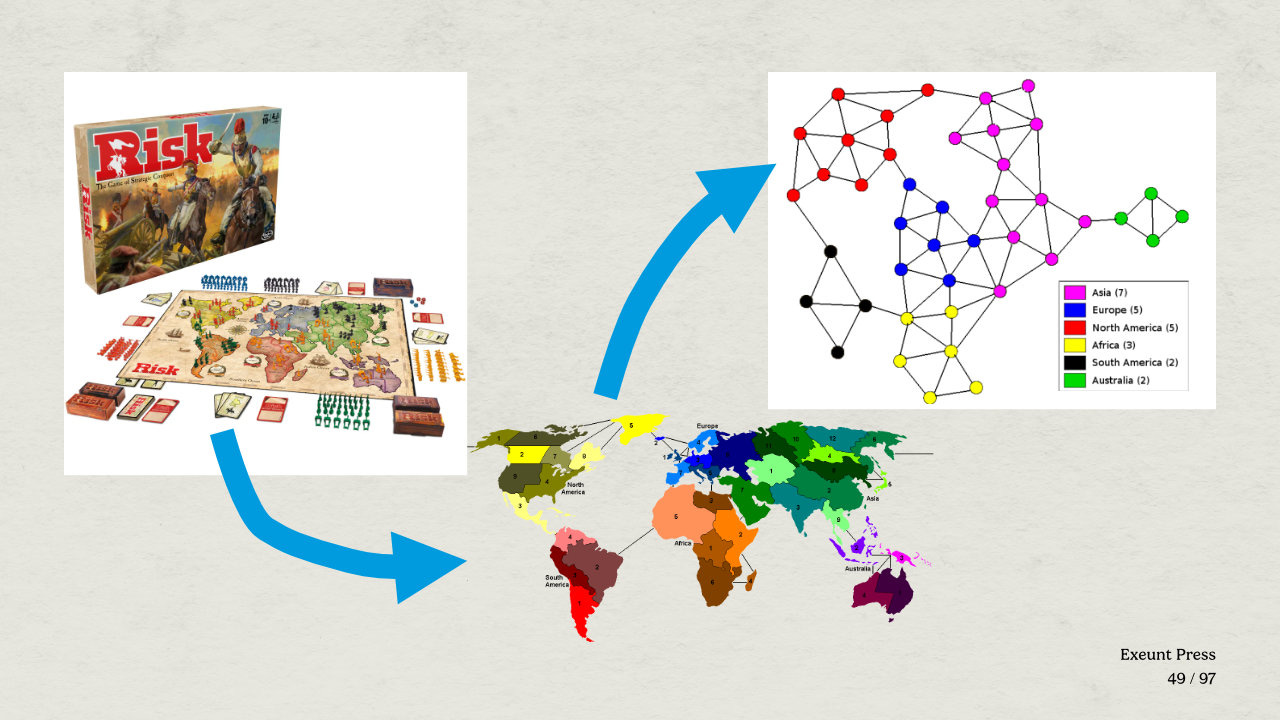
Above is the classic example I always use in the game design classes I teach at public libraries. I show the Risk map expressed as a graph to illustrate theme vs. mechanisms. Risk wouldn’t be nearly as fun as an abstract, themeless game conducted on an undirected graph, but it would be mechanically equivalent.5 It is, therefore, a good introductory example of converting maps into graphs.
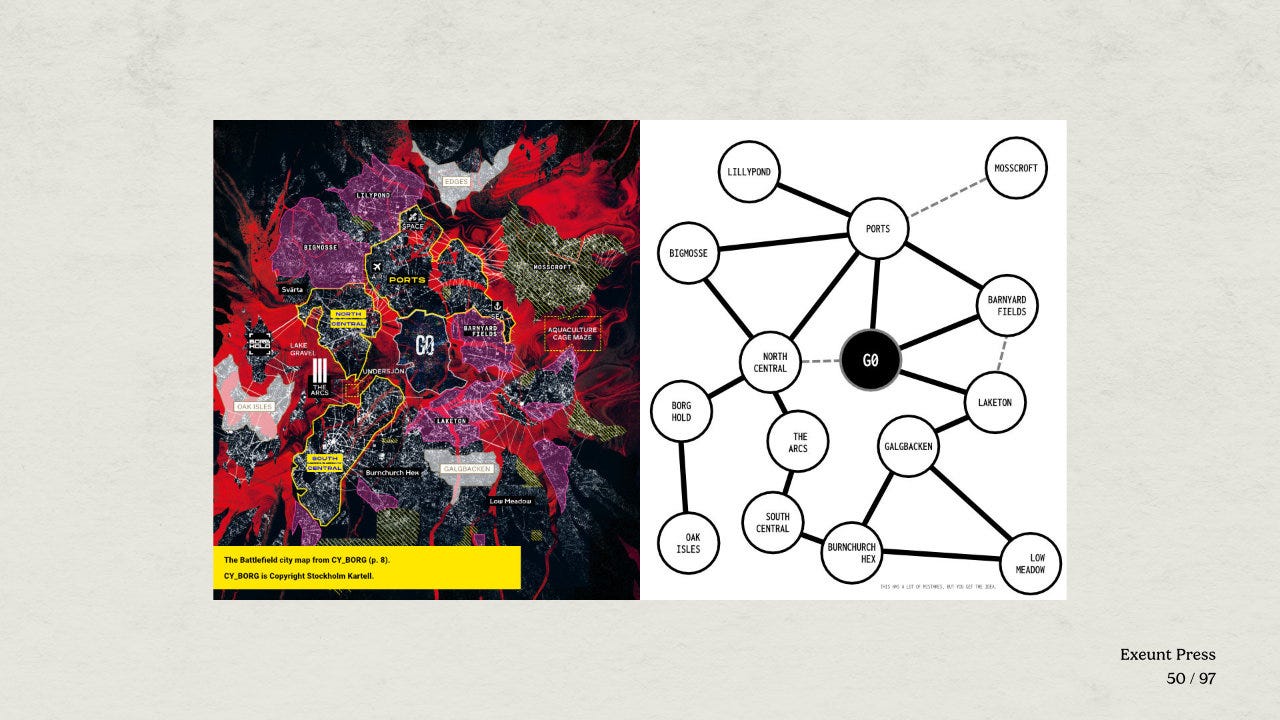
A slightly trickier example is the map of Cy (the main city) from CY_BORG. The map, as shown in the core rulebook, is extremely stylized and (presumably) not intended to be used as a pointcrawl map. If we take adjacency as paths and districts as nodes, we can, however, convert it into a graph.
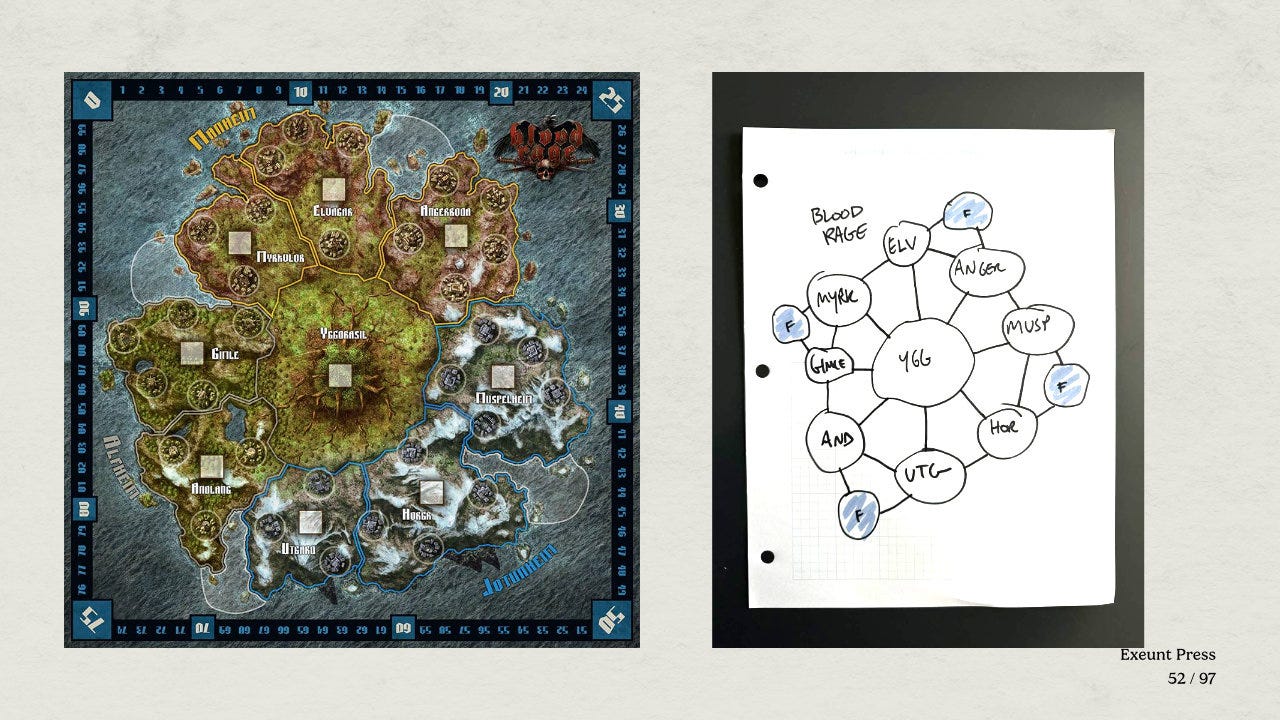
The same can be done for the Blood Rage map as shown above. Immediately, the importance of the fjords (marked “F” and shown in blue) and Yggdrasil (center) becomes obvious. It also shows how the map is more symmetrical than you might first expect.
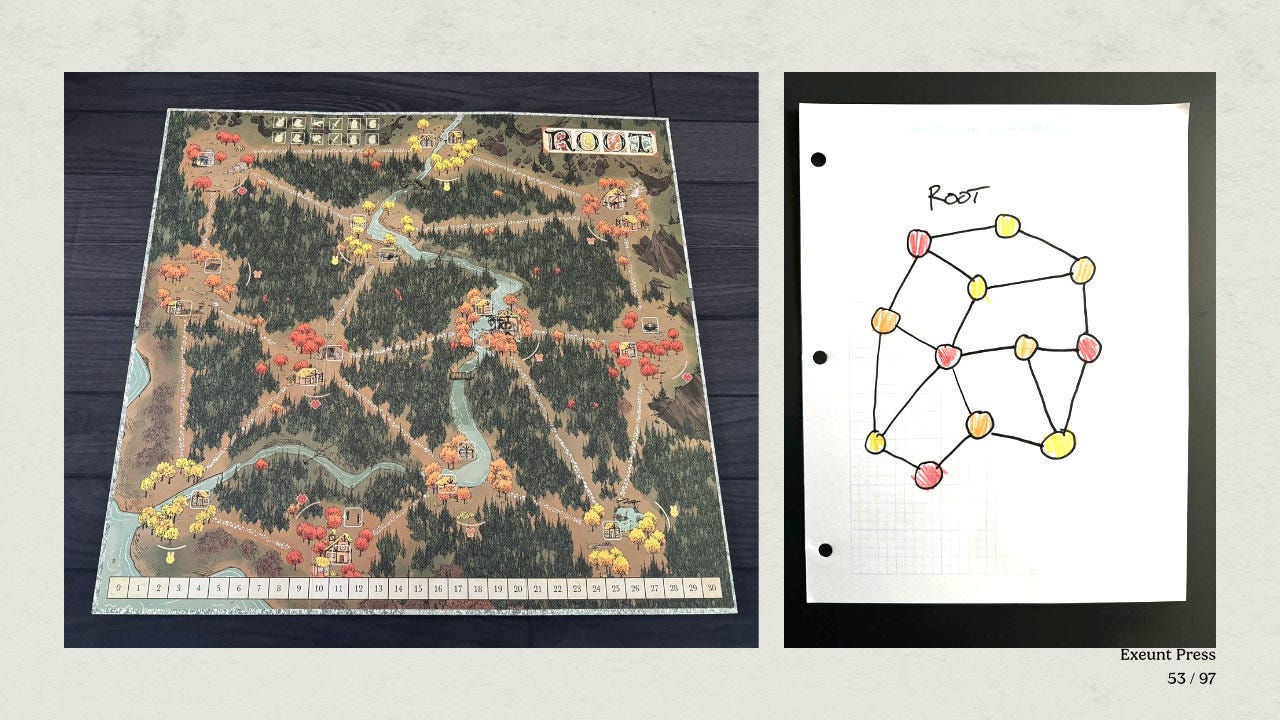
The Root map is almost a graph as displayed in the finished product, but we can simplify it further. The image above shows the game map on the left and color-coded graph equivalent on the right. It becomes more clear how important that red node on the left is (i.e. the one with 5 connections).
Most maps can be reduced to or represented as graphs — a network of nodes connected by lines.
Now you try it!
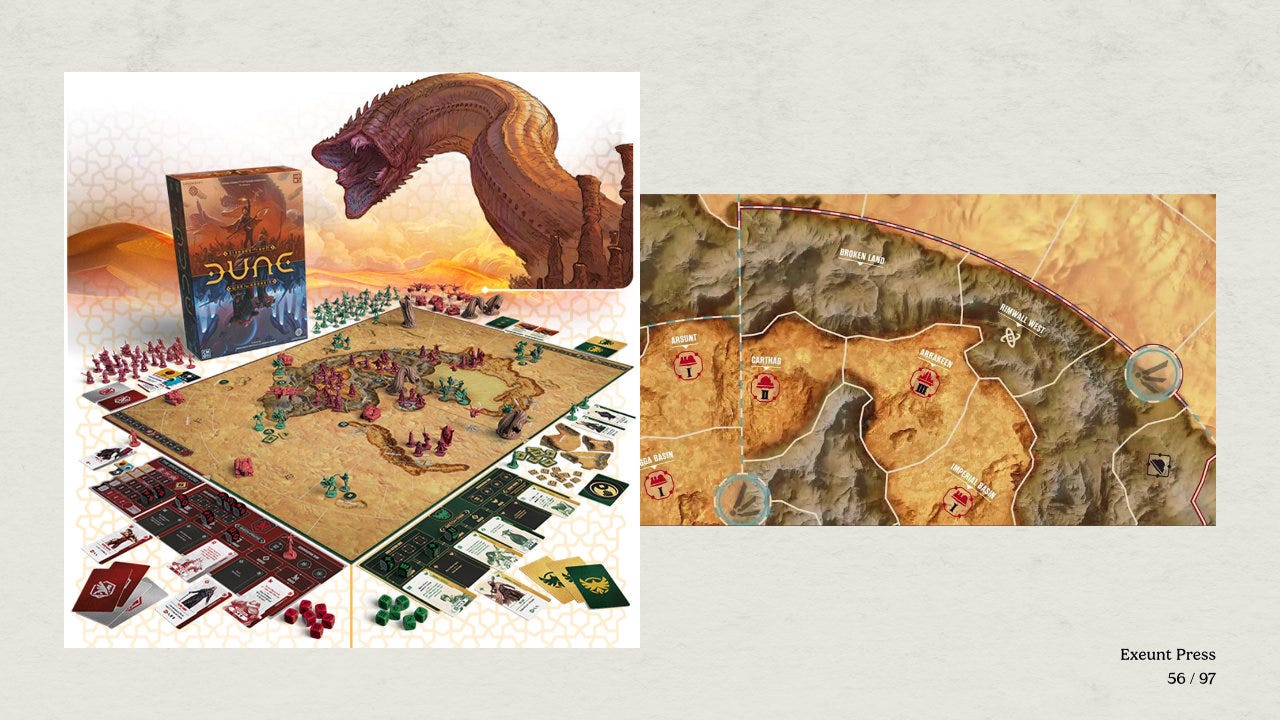
Dune: War for Arrakis has a large, thematic map made up of multiple adjacent zones. There are different terrain types, landmarks, and edges that block paths. The map is too large for a quick map-to-graph exercise, so let’s zoom in on just part of it. I find it’s helpful to mark each area with a dot to get started.
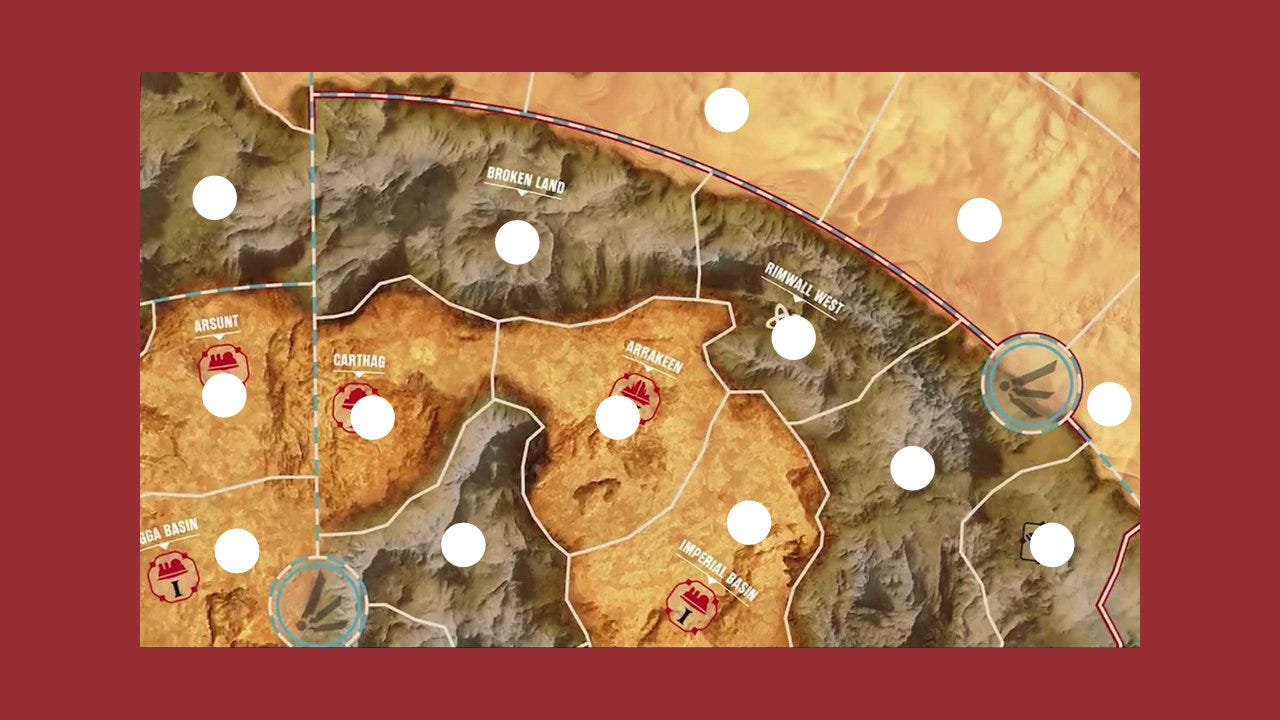
📝 Exercise 3: As a hands-on exercise, try to convert this fragment of the Dune: War for Arrakis map into a graph. Each area will be a node. Consider adjacent nodes as connected paths. Label the nodes where appropriate and note the terrain type.
Got it?
Okay, then here’s what it might look like as a graph:
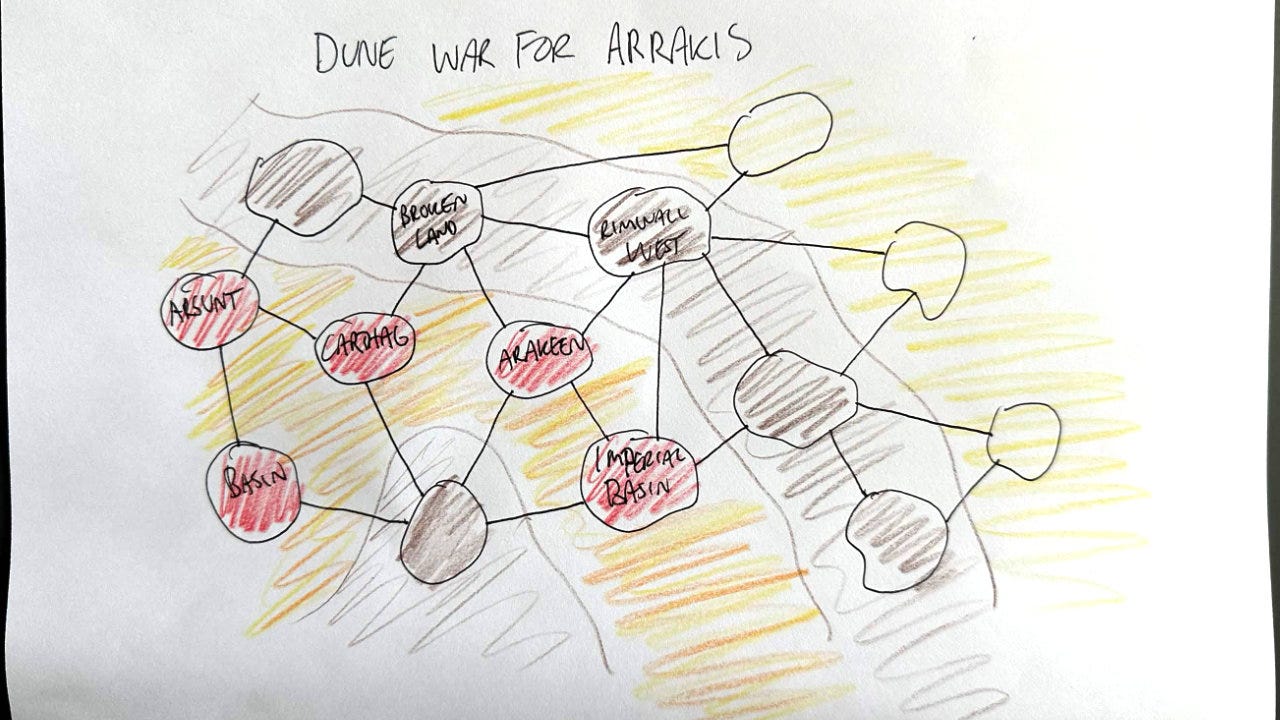
Granted, this is less pretty than the original, but it shows the underlying data of the map. For example, Arakeen stands out as being better connected than Carthag, as it has four connections rather than three. Rimwall West (which can be destroyed in the game) is particularly well connected.
Practice turning maps into graphs
The ability to look at a map and quickly turn it into a graph is a skill that can be practiced and developed. You can use almost any map that you have handy — dungeon maps, board game maps, anything.
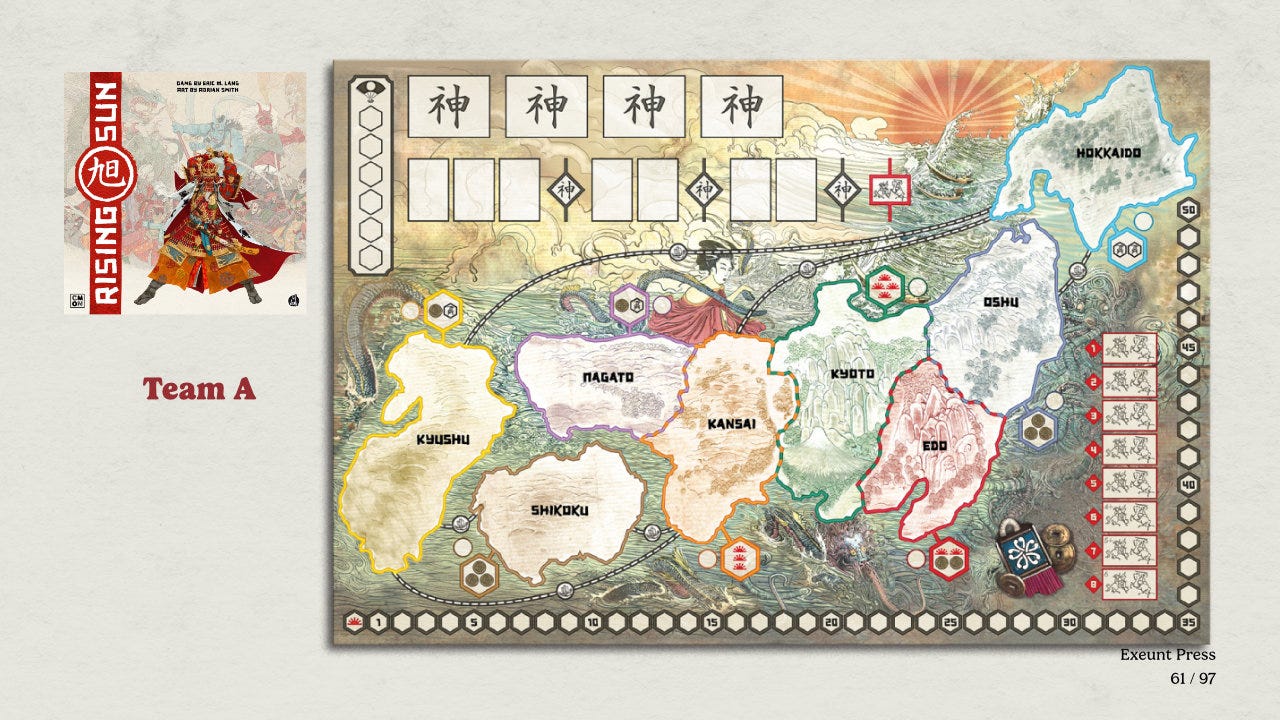
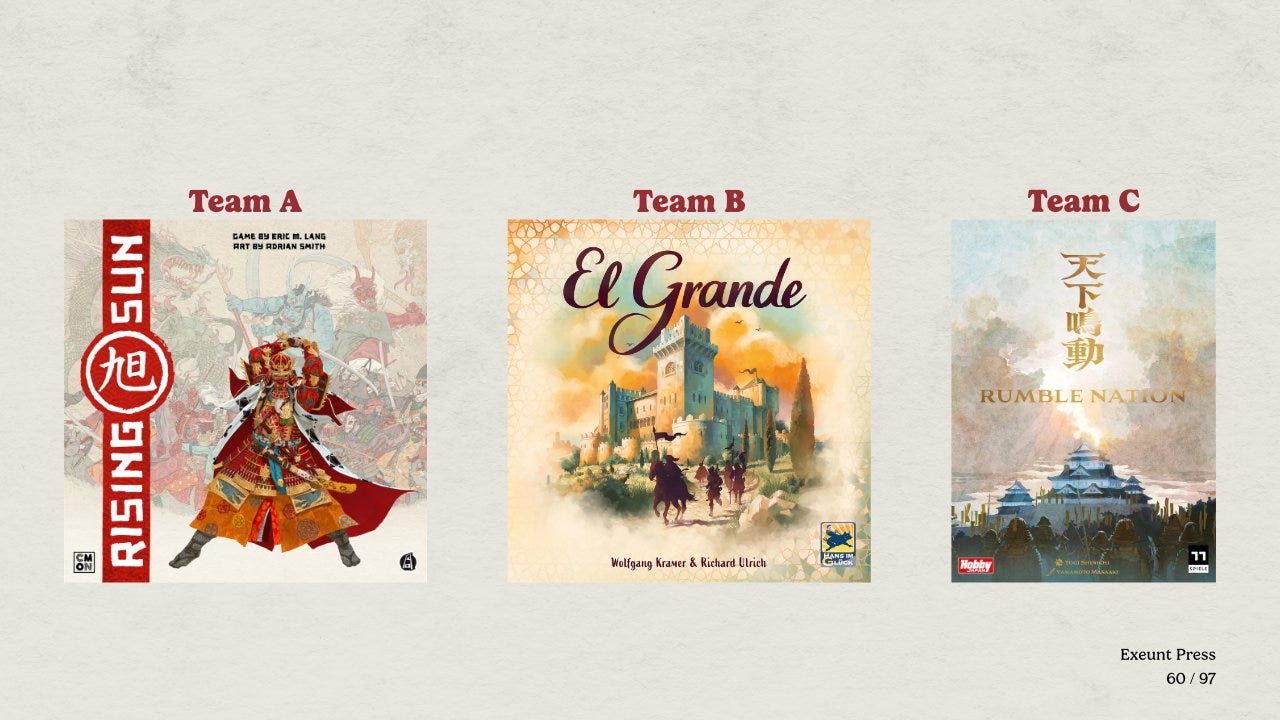
I’ve found the maps from area control games like Rising Sun, El Grande, and Rumble Nation to be particularly good examples. The nodes, connections, edges, paths, and landmarks are obscured by the art and design. Converting these maps into graphs immediately shows the key locations and reveals potential strategies.
📝 Exercise 4: Give it a try! Look up the maps for each of the three games above online. Grab a pencil and paper and convert each one into a graph. How does the graph version of the map change your view of it? Where are the key nodes with the most connections? How would seeing the map as a graph change your strategy?
The other parts
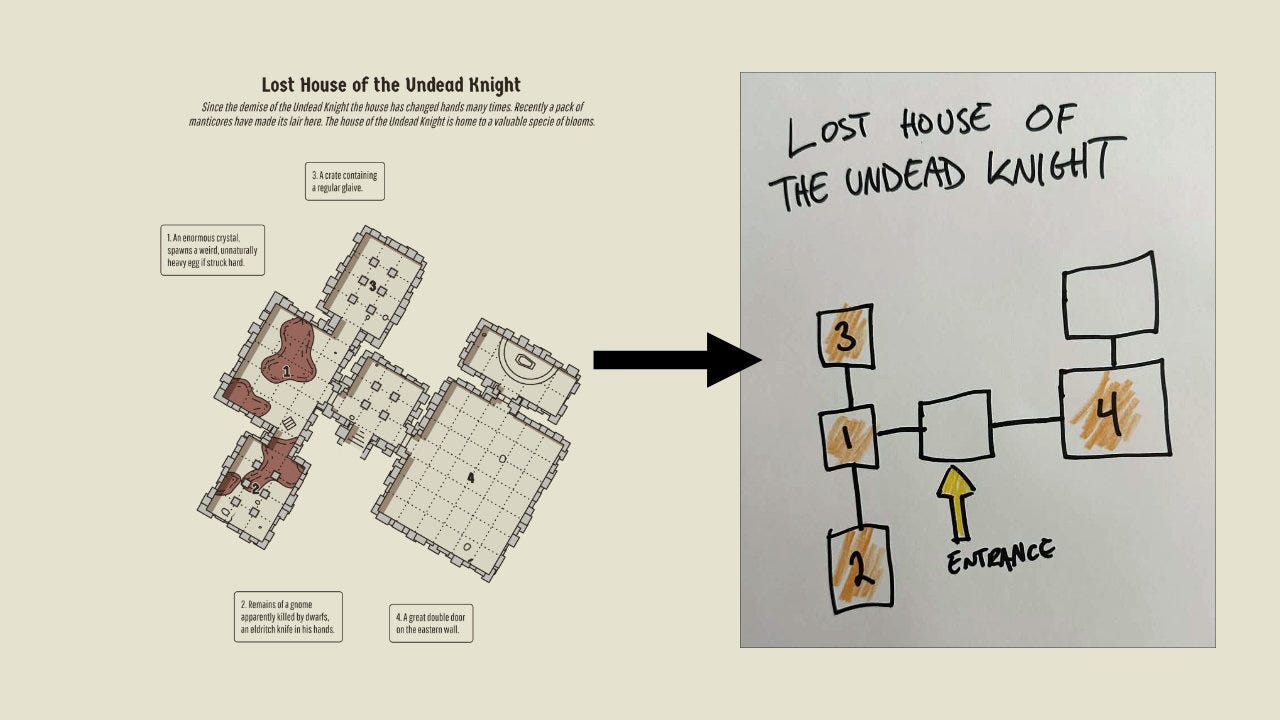
As noted above, this series is based on a talk I gave at Harrisburg University on making better maps. Part 1 was about building a better vocabulary to discuss maps, and Part 2 (this one) was practicing converting maps into graphs.
I covered two other topics with exercises in the class:
Four methods for better maps: Using maps (e.g. The Caverns of Thracia) by Jennell Jaquays as examples, we covered multiple entrances/exits, loops and hubs, discontinuous levels, and secret paths. Many of these concepts are illustrated in Map Crow’s video on how to fix your dungeon.
Five room dungeons: We then used Johnn Four’s Five Room Dungeon model to quickly generate small dungeon maps.6 After adding a boss using Massive Damage, we then analyzed the maps as graphs and improved them using the four methods above. You’d be surprised at how fun the maps became in just one or two iterative design cycles!
We ended the class with a discussion of the Counter-Strike Dust II (de_dust2) map created by David Johnston in 2001. It is a masterwork — combining paths, edges, nodes, districts, and landmarks in interesting ways.
Conclusion
Some things to think about:
Everything is pointcrawl: As I jokingly claimed in the title of Everything is Pointcrawl, almost all maps can be expressed as pointcrawls. This is because, as we saw in Part 1 of this series, maps store data about the relationships of paths, nodes, landmarks, edges, and districts to each other. If graphs are simply a visual representation of the relationship of objects to each other, it makes sense that most maps can be turned into graphs.
Convert and analyze: It can be hard to dissect and analyze a game map in its fully produced form with art and theme applied. By converting game maps to graphs, we can see the underlying information and data contained within the map. We can then analyze and improve the map.
Practicing skills: By practicing the skill of converting maps into graphs, we can get better at it. Eventually, it will be almost impossible to look at a map without seeing the underlying data as a graph. Having this ability will allow you to make better maps.
What do you think? How did you do on converting maps into graphs? Can you think of a map that would be particularly tricky to convert? If so, leave it in the comments below!
— E.P. 💀
P.S. Want more in-depth and playable Skeleton Code Machine content? Subscribe to Tumulus and get four quarterly, print-only issues packed with game design inspiration at 33% off list price. Limited back issues available. 🩻
Skeleton Code Machine is a production of Exeunt Press. All previous posts are in the Archive on the web. Subscribe to TUMULUS to get more design inspiration. If you want to see what else is happening at Exeunt Press, check out the Exeunt Omnes newsletter.
Skeleton Code Machine and TUMULUS are written, augmented, purged, and published by Exeunt Press. No part of this publication may be reproduced in any form without permission. TUMULUS and Skeleton Code Machine are Copyright 2026 Exeunt Press.
For comments or questions: games@exeunt.press
Note that I am specifically calling out exploration-based games where none of the hexes are defined at the start of the game. This is a special case, but one that does come up. Well-designed hexcrawl maps that have defined hexes from the start do not necessarily have this problem.
The potential issues weren’t resolved simply by converting the map to a pointcrawl. As noted in Epsilon Update No. 4, the map also has multiple competing objectives and multiple entry/exit points. All of this makes paths and routes matter.
Note that there is an opportunity for confusing terminology here. We called some of the features of a map “edges” in Part 1 but the definition of an “edge” in graph theory more closely matches the “path” feature in the previous part. Same word, different meanings.
You can read about how Turtchester turned into Ratsail and its playtesting at Unpub at Exeunt Omnes.
Two notes here: (1) In the classes, I usually show the graph version of the Risk map without any context and see if people can guess which game it is. It’s always Australia that gives it away, so I’ve started rotating or mirroring the map to make it a little more obfuscated. (2) I say mechanically equivalent, but there may be additional information contained in the map beyond just the graph. For example, if there are area or continent bonuses, effects, and so on. So there may be exceptions where this is not strictly true.
I really like and appreciate the Five Room Dungeon model. The students in the class seemed to instantly get it and respond favorably, even the ones without much TTRPG experience. In the future, however, I might consider integrating THORCS! into the class if I were to teach it again. The downside is that it would require more time to explain and the exercises would take longer.
What an interesting concept of visually interpreting/translating game maps into a different format!
Great article, thank you!